How to Choose Thermal Putty for Global Sourcing?
Global sourcing has made thermal materials easier to compare, but harder to choose correctly. Thermal Putty must perform across different devices, climates, production lines, and supplier capabilities. A higher thermal conductivity value does not automatically guarantee better cooling. Application pressure, surface gaps, cure behavior, pump-out resistance, and long-term stability also matter.
Industry data shows why this decision deserves careful review. MarketsandMarkets estimates that the global thermal interface materials market will grow strongly through 2028, driven by electric vehicles, data centers, 5G equipment, and advanced electronics. Yole Group has also reported rising thermal-management demands in high-performance computing and power electronics. These sectors commonly use dense layouts and high heat flux. A small interface failure can create a visible hotspot near a processor, battery module, or power transistor.
A practical sourcing process should connect laboratory data with production evidence. Request test methods, not only advertised conductivity figures. ASTM D5470 and related thermal-interface testing practices can help compare materials more consistently. Check density, hardness, operating temperature, dispensability, shelf life, and packaging stability. Ask suppliers for lot-to-lot records and samples from actual production batches. Confirm RoHS, REACH, and other destination-market documentation before purchase.
There is no universal best grade.
My experience suggests that a softer putty may fill uneven surfaces well, yet create handling or pump-out concerns later. That trade-off is easy to miss during a short trial. This guide explains how to evaluate Thermal Putty suppliers, technical claims, qualification evidence, logistics, and total sourcing risk. Some decisions will still require testing under real assembly conditions. That is the uncomfortable, necessary part.
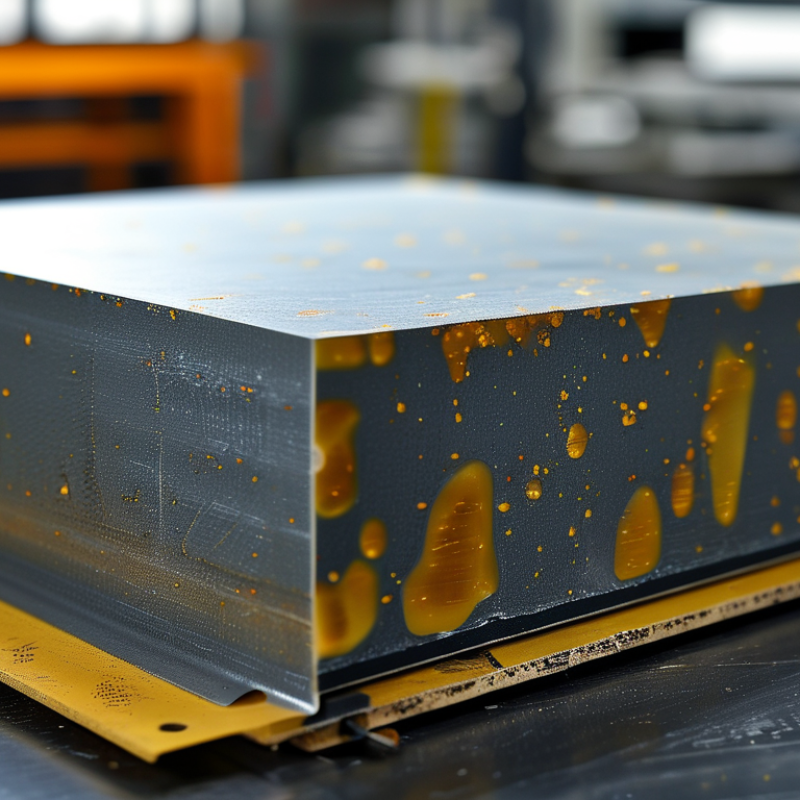
Define Thermal Putty by Thermal Conductivity: 1–15 W/m·K
How to Choose Thermal Putty for Global Sourcing?
Thermal putty should be defined by thermal conductivity, usually measured from 1 to 15 W/m·K. Lower grades, around 1–3 W/m·K, suit moderate heat and wider gaps. Materials from 3–8 W/m·K offer a practical balance for many electronic assemblies. High-performance grades, near 8–15 W/m·K, target compact designs with concentrated heat loads. Higher conductivity is not automatically better. It often brings higher cost, tighter processing demands, or greater filler content.
During sourcing, request the exact test method behind the conductivity value. ASTM D5470 results may differ from internal laboratory data. Check the tested thickness, pressure, temperature, and sample conditioning. A 10 W/m·K result at one millimeter may not reflect performance inside a thin production gap. Ask for batch records, technical data sheets, safety documents, and independent test reports. Verify these details with production samples.
Real assembly work has taught me one uncomfortable lesson: a good datasheet can still produce disappointing contact. Surface roughness, dispensing volume, and compression strongly affect heat transfer. Thermal resistance matters more than conductivity alone. Test the putty on your actual housing, processor, or power module. Measure temperature under normal load, then repeat after thermal cycling. Do not ignore storage life. I have seen material performance change after poor warehouse handling. That mistake is avoidable, but only when sourcing teams inspect the complete system rather than chasing one impressive number.
Match Gap-Filling Performance to 0.1–5 mm Interface Thickness
When sourcing thermal putty globally, start with interface thickness, not catalog conductivity.
A 0.1 mm gap needs controlled bond-line thickness and low contact resistance.
At 1–2 mm, wetting and void filling become more important.
A 5 mm gap demands high build retention, low pump-out, and stable compression behavior.
These ranges are practical screening points, not universal rules.
The International Energy Agency reported that data centers consumed about 460 TWh globally in 2022. Demand could exceed 1,000 TWh by 2026.
Uptime Institute’s 2024 Global Data Center Survey reported an average PUE of 1.56. Small thermal losses can therefore increase operating costs.
ASTM D5470 measures thermal impedance under defined pressure and thickness. Request those conditions. Conductivity alone is incomplete. It can mislead.
For 0.1–0.5 mm, check dispense control, viscosity, and thickness tolerance.
For 0.5–2 mm, compare impedance at the actual gap, not a nominal 1 mm.
For 2–5 mm, test compression set, pump-out, sag, and thermal cycling.
Use real heat sources and clamping hardware. Supplier data often uses polished test coupons. Your rough cast surface may perform differently.
This is where first-pass evaluations often fail. Ask for batch consistency, aging results, safety documentation, and independent laboratory evidence before approving a global supplier.
Compare Shore 00 Hardness, Compression, and Pump-Out Resistance
How to Choose Thermal Putty for Global Sourcing?
Thermal putty selection starts with Shore 00 hardness, not price. ASTM D2240 defines Shore 00 testing for very soft materials, but results vary with temperature, dwell time, and sample thickness. A putty below 20 Shore 00 may fill uneven surfaces easily. However, it can spread excessively during assembly. Materials around 30–60 Shore 00 often provide better handling and gap conformity. These are screening ranges, not universal rules. Uptime Institute’s 2024 Global Data Center Survey reports continued growth in high-density racks, increasing pressure on thermal interfaces and long-term stability.
Compression behavior matters under real mounting force. Request stress data at 25%, 50%, and 75% compression. ASTM D395 can help compare compression set, although it does not fully reproduce a heated processor assembly. Low compression force protects fragile components. Excessive compression may cause contact loss after repeated expansion and contraction. ASTM D5470 measures thermal resistance, but it does not predict pump-out. I once overvalued initial thermal performance. That was a mistake. After thermal cycling, a softer sample showed visible edge migration and higher interface resistance.
Tips: Ask suppliers for Shore 00 results at your operating temperature. Require compression-force curves, not one-point values. Run thermal cycling with your actual gap, surface finish, and clamp pressure. Record pump-out by mass loss, edge displacement, and thermal resistance change. A 10% resistance increase may matter more than a slightly better first test. Test samples from different production lots. Consistency is often overlooked.
How to Choose Thermal Putty for Global Sourcing? - Compare Shore 00 Hardness, Compression, and Pump-Out Resistance
| Thermal Putty Profile | Typical Thermal Conductivity
(W/m·K) | Shore 00 Hardness
(Typical Range) | Compression Stress at 25% Strain
(Typical Range) | Recommended Compression in Assembly | Pump-Out Resistance
(Thermal Cycling) | Best-Fit Application | Global Sourcing Consideration |
| Ultra-Soft Gap-Filling Putty | 1.5–3.0 | Shore 00: 10–20 | 5–20 kPa | 20–50% | Medium | Low-pressure interfaces, uneven component heights, delicate packages, and narrow contact areas. | Excellent wetting and low assembly force, but packaging, liner release, and contamination control require close validation. |
| Soft General-Purpose Putty | 2.5–4.5 | Shore 00: 20–35 | 15–45 kPa | 15–35% | High | Power converters, memory modules, control boards, telecom equipment, and general electronics cooling. | Usually the best balance between conformability, compression force, handling, and long-term interface stability. |
| Medium-Soft Structural Putty | 3.5–6.0 | Shore 00: 30–50 | 35–90 kPa | 10–25% | High | Automotive electronics, industrial controllers, high-vibration assemblies, and interfaces requiring greater shape retention. | Higher compressive force and fixture tolerance may be needed; verify enclosure flatness and component mechanical limits. |
| High-Conductivity Filled Putty | 6.0–10.0 | Shore 00: 35–60 | 60–150 kPa | 8–20% | High | High-power semiconductors, battery systems, inverters, and assemblies with demanding thermal resistance targets. | Filler loading can increase viscosity, density, and compression stress; validate dispensing equipment and total applied mass. |
| Low-Compression Enclosure Putty | 1.0–3.0 | Shore 00: 15–30 | 8–30 kPa | 15–40% | Medium | Large-area covers, removable heat sinks, low-clamp-force housings, and applications with broad tolerance variation. | Prioritize low compression set, clean rework, and resistance to migration during storage and transportation. |
| High-Vibration Retention Putty | 2.0–5.0 | Shore 00: 25–45 | 25–80 kPa | 10–25% | High | Vehicle electronics, outdoor power equipment, industrial drives, and systems exposed to repeated shock or vibration. | Request dynamic mechanical data, adhesion information, and pump-out results using the intended mounting orientation and clamp load. |
Note: The values above are representative engineering ranges commonly used for preliminary material screening, not guaranteed supplier specifications. Final selection should be confirmed using the same test method, specimen thickness, compression ratio, temperature range, thermal-cycling profile, and dispensing process used in the target product. Shore 00 hardness and compression stress are not interchangeable; a lower hardness does not always mean lower long-term pump-out risk.
Verify Operating Temperatures from −40°C to 200°C
Choosing thermal putty for global sourcing starts with its real operating window. A label claiming −40°C to 200°C is not enough. Ask whether the rating covers continuous use, short exposure, or storage only. The International Electrotechnical Commission’s IEC 60068-2-14 standard supports temperature-change testing for electronic assemblies. IPC-9701A also includes cycling conditions reaching −40°C and 125°C. These figures show why a product rated for 200°C still needs validation under repeated thermal stress.
Check thermal conductivity, thickness, compression, and aging together. Thermal resistance follows Rth = t ÷ (k × A), so a thick layer can reduce performance even when conductivity looks impressive. Request test curves at −40°C, room temperature, 125°C, and 200°C. A 2023 U.S. Department of Energy report on power electronics highlights rising thermal loads and the need for reliable heat paths in compact systems. However, supplier data may use different test pressures. Direct comparisons can be misleading.
Tips: Request samples from at least two production lots. Measure bond-line thickness after assembly. Run thermal cycling before approving volume orders. Record hardness changes, pump-out, and surface drying. Ask for test uncertainty, not only average values. A simple mistake remains possible: one laboratory result cannot represent every application. Verify the material with your own enclosure, pressure, and airflow conditions.
How to Choose Thermal Putty for Global Sourcing?
Verify that the thermal putty’s specified operating range covers the complete application profile, including transportation, storage, startup, continuous operation, and short-term peak temperatures.
The chart shows representative operating-temperature ranges commonly specified for generic thermal-interface material formulations. Actual limits vary with formulation, thickness, compression, aging, and test method. Confirm the −40°C to 200°C requirement against the supplier’s technical datasheet and validation report.
Audit RoHS, REACH, UL 94 V-0, and Global Supplier Compliance
How to Choose Thermal Putty for Global Sourcing?
Global sourcing starts with compliance, not price. The 2024 Global E-waste Monitor reported 62 million tonnes of electronic waste in 2022. It projects 82 million tonnes by 2030. Thermal putty suppliers must therefore provide traceable materials and stable production records. Ask for a current RoHS declaration covering all ten restricted substances. Request test methods, laboratory dates, and material revision numbers. A generic statement is weak evidence.
REACH needs deeper review. The European Chemicals Agency’s Candidate List contains more than 240 substances of very high concern. Confirm whether the putty, packaging, and manufacturing aids contain listed substances. Check articles, mixtures, and regional reporting duties separately. For flame performance, UL 94 V-0 testing requires each test specimen to stop burning within ten seconds after flame applications. Obtain the actual test report, not only a supplier logo or claim. Thermal conductivity data also needs conditions. Temperature, pressure, thickness, and test method can change the result.
Tips: Build a supplier file with SDS, RoHS, REACH, UL 94, lot records, and change-control procedures. Audit one production lot physically when possible. Compare the putty’s datasheet with the delivered sample. I have seen paperwork look complete while batch details were missing. That is uncomfortable, but useful. Recheck compliance annually, especially after formulation or factory changes. A small gap today can become a customs delay, redesign, or field failure tomorrow.










 +91-97254 16844