o
p
t
i
m
a
r
o
b
o
t
i
c
s

Make a Call


Make a Call
Blogs
Why Invest in a POY Spinning Line for Global Production?
Investing in a POY Spinning Line can strengthen global production when demand, quality, and delivery schedules remain unpredictable. A modern line converts polymer chips into partially oriented yarn with controlled speed, tension, and temperature. These details matter. Even a small fluctuation can affect denier, elongation, dye uptake, and fabric appearance.
Textile machinery consultant Dr. Elena Maric states, “A POY line creates value through stable yarn quality, not maximum speed alone.” Her observation reflects a practical concern for manufacturers. Higher output looks attractive, but unstable winding can create waste, customer complaints, and expensive downtime. A well-designed POY Spinning Line supports consistent packages, automated monitoring, and faster changeovers across multiple yarn specifications. It can also reduce manual handling around heated components and moving equipment.
Global production needs more than impressive capacity. It needs dependable operation near the customer. A strategically located line can shorten shipment times and reduce exposure to freight delays. Energy consumption also deserves close attention. Efficient drives, heat management, and preventive maintenance can improve operating costs over several years. The savings are not automatic. They depend on disciplined production data and trained technicians.
There is a weakness worth admitting. No spinning line removes market risk. Demand can fall, raw-material prices can shift, and equipment may perform below expectations without proper commissioning. Buyers should compare lifecycle costs, supplier support, spare-parts access, and verified running results. Factory visits and trial-yarn testing are especially valuable. A thoughtful investment may therefore offer stronger resilience, but only when technology matches the company’s actual products, workforce, and export strategy.
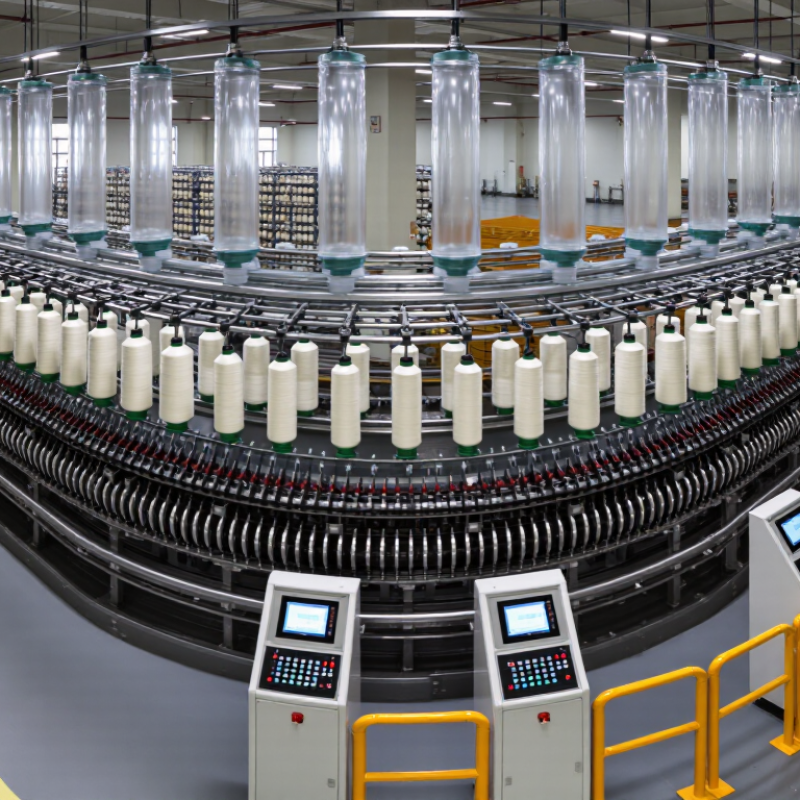
Table of Contents [Hide]
Understanding POY Spinning Lines and Their Role in Global Production
A POY spinning line produces partially oriented yarn from polymer melt through controlled extrusion, cooling, drawing, and winding. This process supports fabrics, textured yarn, and many downstream textile applications. In global production, the line connects raw material planning with consistent yarn supply.
A well-designed line can maintain stable denier, winding tension, and package shape across long production runs. Operators monitor melt temperature, spinneret pressure, quench airflow, and godet speed. Small deviations may create uneven dye absorption or weak sections. Quality data matters.
Real factory experience shows that automation improves repeatability, but it does not remove operational risk. Filters still need timely replacement. Cooling systems require attention in hot climates. Power quality can also affect sensitive control units. These details influence output more than a brochure suggests.
A POY spinning line may help producers shorten delivery cycles and reduce dependence on distant suppliers. However, capacity should match actual demand, workforce skills, utility stability, and available maintenance support. Buying excessive capacity can leave machines underused and increase financial pressure. That possibility deserves honest review.
Global production also requires flexible specifications. Different markets may request varied filament counts, luster levels, package weights, or traceability records. A practical line should allow controlled adjustments without sacrificing yarn consistency. Measured improvements are more valuable than impressive claims. Reliable production grows through disciplined settings, documented inspections, and operators who question abnormal results.
Brands
Proudly Trusted by Top Suppliers Worldwide


Let us know and we will automate, together to fit your industrial needs.
 +91-97254 16844
Clients
Proudly Trusted by Top Companies Worldwide


Do you need Help? Get in touch.
X
Please fill out the form below and we will get back to you as soon as possible.